Understanding Option Greeks: A Deep Dive into Gamma
This is the TradingFlow Team, and in today's analysis, we'll explore the concept of gamma impact using the Gamma Exposure feature on Trading Flow in Option Chain Analysis, focusing on the S&P 500 ETF Trust ($SPY).
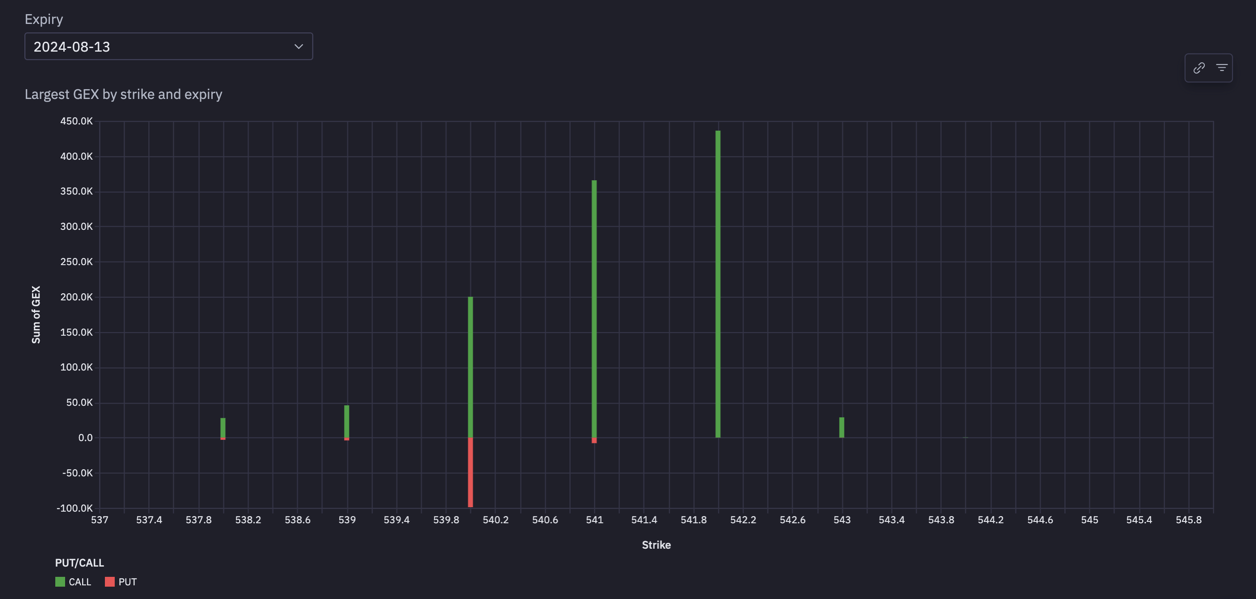
To illustrate gamma impact, we'll examine the $542 strike for SPY on August 13, 2024.
At the close of trading on August 13th, we noticed a significant negative gamma bar at the $542 strike in $SPY, which was surprising given the strong rally $SPY experienced throughout the day. There was notable activity at this strike, particularly with Calls. On a day with an upward trend, it was expected that there would be high volume for options expiring that same day (0DTE), given that gamma is a short-term effect and short-dated options typically have the highest gamma values.
For further investigation, we reviewed the options chain for SPY, specifically the 0DTE $542 call contract that expired on August 13th. By selecting Contract Level Explorer within Historical Option Trades that next to Option Chain Analysis, then selecting Size with the proper symbol, expiration date, strike price, and call/put, finally scolling down to the second graph, we accessed the intraday data for this contract.
Immediately, we observed a large spike in ask-side transactions at the $542 strike, with over 25,000 contracts traded around 10:50 AM ET. The average fill price for these contracts was $0.11. The low cost of these contracts, on such a large and liquid instrument as SPY, indicated that they were far out of the money at the time of the transaction. As a result, despite the high volume, the distance from the spot price led to a relatively minor directional gamma impact. To confirm, we clicked on the relevant volume bar.
Upon clicking, we were directed to the OI Rank Change in Option Chain Analysis page, where filters were set to the selected time interval and the selected symbol, and our assumption was validated—the directional gamma impact of the trade was indeed small. To illustrate this, we did some quick calculations.
For simplicity, let's round the trade size to 24,000 contracts. To calculate the total gamma, we multiply the number of contracts (24,000) by 100 (the number of shares each contract represents), and then multiply that by the contract's gamma (0.0589): 24,000 x 100 x 0.0589 = $141,360. This indicates that the impact of this single trade on the entire $SPY options complex was a relatively small $141,360 per 1% move in the underlying asset. Despite the large position size, the gamma impact was minimal.
As the day progressed, the markets rallied strongly. The $SPY price rose from $538.32, closing the regular trading session above $542. Around 1:00 PM ET, we noted a substantial bid-side order for 8,000 SPY $542C contracts.
Let's assume this was the original trader ("Mr. 25K") partially closing their position. Since the spot price was now much closer to the strike price ($541.15), the contract's gamma had increased significantly from 0.0589 to 0.4203—an almost 614% rise. As a result, the 8,000-contract bid-side transaction had a much more pronounced gamma effect.
To quantify this:
8,000 x 100 x -0.420347 = -$336,227.6 per 1% move
(Source: Unsplash)
Earlier, we saw that the 25,000-contract order had a relatively small positive gamma impact, even with a large volume. However, this 8,000-contract bid-side transaction, despite being only 32% of the size of the previous ask-side order, had a much larger negative gamma impact because the spot price was now much closer to the $542 strike. As the day went on, the gamma value for the $542 strike contracts continued to grow, since both Calls and Puts were near the money. This means that as more transactions occurred at the $542 strike, especially those involving the highly profitable $542 Calls, the spot gamma bar for $542 became increasingly negative.
While we won't replicate all the calculations needed to fully account for this effect (as it would require aggregating all $542 strike Call and Put trades across all expirations), this example demonstrates how a small positive gamma impact early in the day can evolve into a large negative gamma impact later on, helping to explain the seemingly counterintuitive "market up, spot gamma negative" bar on the chart.
If you like this article, please subscribe. To use all the tools, start a free trial for 14 days now.
Disclaimer: This article is for informational purposes only and does not constitute investment advice. Before making any financial investment decisions, please ensure you thoroughly understand all aspects of the information and conduct your own research.
🎁 Bonus time 🎁 with Moomoo, one of the most cost-effective investment platforms currently on the market!
Click the link below to try moomoo and receive your welcome free stock and cash sweep bonus! 👉: https://j.moomoo.com/00IRhe


